The software also comes with numerous predefined reports which produce
statistical analyses of: 1) your wine cellar 2) the entire wine database or 3) a selected
subset of the database. 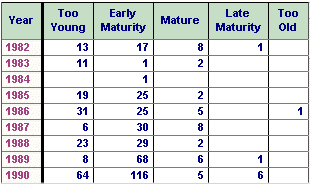 For example, as shown, you can ask for an analysis of wines based upon
their maturity. The computer will look at the date range specified by
Robert Parker for drinking each wine and the current date. Based upon
this comparison wines will be grouped in drinking maturity ranges, as
shown. The wines can be further subdivided based upon variety (as
shown), producer, vintage, country and a number of other factors. Note
that only 2 of the 70 varieties found are shown in this example.
For example, as shown, you can ask for an analysis of wines based upon
their maturity. The computer will look at the date range specified by
Robert Parker for drinking each wine and the current date. Based upon
this comparison wines will be grouped in drinking maturity ranges, as
shown. The wines can be further subdivided based upon variety (as
shown), producer, vintage, country and a number of other factors. Note
that only 2 of the 70 varieties found are shown in this example.
Another analysis looks at wines in your cellar or in any subset you choose from the entire wine database by Parker's rating ranges. The ranges are according to the scale of 50-100 used in The Wine Advocate.
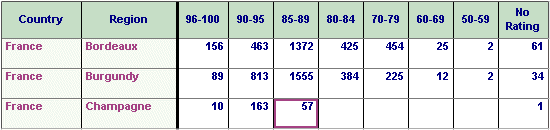
Within this scale wines are grouped as:
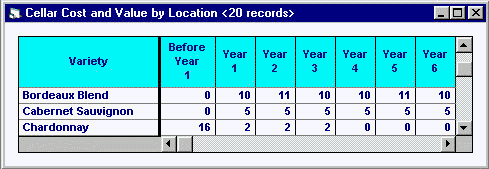 Yet one more analysis is
the automated Drink Plan.
Here the computer looks at the quantity of wines in your cellar based
upon any of the subdivisions available (variety, producer, vintage,
country and others) and shows how many bottles are available during each
year over the next decade. Consideration is given for the date range
during which each wine should be consumed according to Parker. The
computer assumes that each wine will be consumed at a constant rate
during that range. Thus, for example, if your cellar contains 10
bottles of a chardonnay which should be drunk over the next two years
according to Parker, the computer will add five bottles each year to the
Drink Plan. Note that only 3 of the 20 varieties found and 6 of the 10
years reported are shown in this example.
Yet one more analysis is
the automated Drink Plan.
Here the computer looks at the quantity of wines in your cellar based
upon any of the subdivisions available (variety, producer, vintage,
country and others) and shows how many bottles are available during each
year over the next decade. Consideration is given for the date range
during which each wine should be consumed according to Parker. The
computer assumes that each wine will be consumed at a constant rate
during that range. Thus, for example, if your cellar contains 10
bottles of a chardonnay which should be drunk over the next two years
according to Parker, the computer will add five bottles each year to the
Drink Plan. Note that only 3 of the 20 varieties found and 6 of the 10
years reported are shown in this example.
Producing any of these reports (or dozens of others not shown here) is simply a matter of asking for it. There are no complex questionnaires to complete. Production typically takes a few seconds.